
The folklore: local models are just dumber than cloud models, and no amount of tinkering will change that. The measured: a surprising share of “dumb” is configuration — and every one of the six most common configuration mistakes leaves a fingerprint you can measure.
The setup-then-disappointed cycle
A Hacker News thread titled “Why your local LLM feels dumber than it is” pulled 511 points and 207 comments, and the title describes a pattern we see across beginner feeds almost weekly: someone installs a model, asks it a question, watches it underperform, and concludes that local AI is overhyped. Setup, disappointment, uninstall, post about it. The cycle repeats with minor variations — sometimes it’s a chat answer that rambles, sometimes an agent loop that falls apart on step two, sometimes a code suggestion that wouldn’t compile.
Sometimes that conclusion is correct, and we’ll say so plainly in the caveats below. But in our benchmark lab, the same six configuration traps account for a large share of the disappointment, and each one is measurable. This article walks through all six with the numbers we have, then gives you a 15-minute checklist to find out which trap is biting you.
Trap 1: The wrong quant for the workload
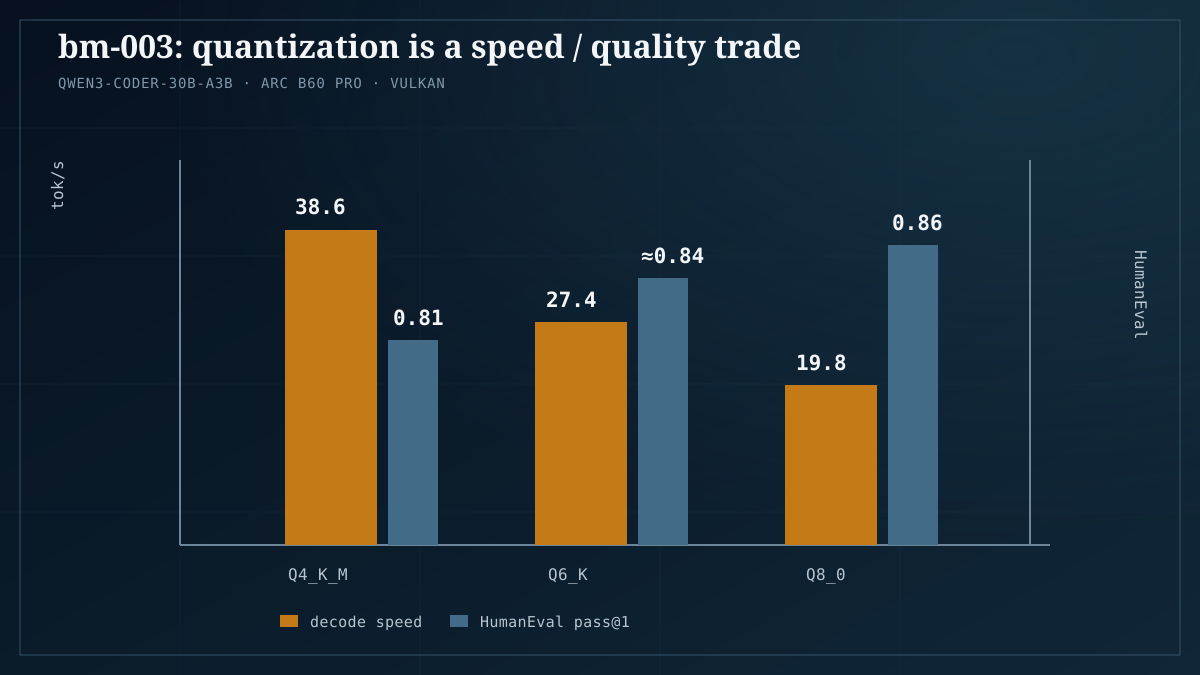
Quantization is the most common trap because it’s the most invisible. You download a GGUF, the filename says Q4, and nothing tells you what that choice cost you — or saved you.
Our quantization sweep (benchmark bm-003) ran Qwen3-Coder-30B-A3B on an Arc B60 Pro via Vulkan at three quant levels and measured both speed and quality on HumanEval pass@1:
| Quant | Decode speed | Total memory | HumanEval pass@1 |
|---|---|---|---|
| Q4_K_M | 38.6 tok/s | 18.1 GB | 0.81 (−5 points vs Q8_0) |
| Q6_K | 27.4 tok/s | 22.6 GB | −2 points vs Q8_0 (≈0.84) |
| Q8_0 | 19.8 tok/s | 24 GB (saturated) | 0.86 (baseline) |
Read that table two ways. If your workload is code generation and quality matters, Q4_K_M’s five-point drop is real — you’re leaving measurable capability on the table to gain speed. If your workload is chat, summarization, or drafting, the same trade usually runs the other way: Q4_K_M nearly doubled throughput (38.6 vs 19.8 tok/s) and cut memory from saturating 24 GB to 18.1 GB, which is why Q4-class quants remain the sensible default for most people. The trap isn’t “Q4 is bad.” The trap is picking a quant without knowing which side of that trade your workload sits on.
The other half of this trap is at the bottom of the bit scale. The corpus is currently buzzing about 1-bit and ternary “brain damage quants,” and the name is doing real work: extreme low-bit quantization is exactly where people report models that feel lobotomized — and then blame local AI as a category. Our sweep starts at Q4, so we can’t put a number on the 1-bit penalty ourselves; what we can say is that the symptom reports line up precisely with the disappointment pattern, and that we treat any quality claim below Q4 as unproven until measured. For the full framework — which quants hold up for which workloads — see Quantization in 2026: no-compromise settings.
Trap 2: KV-cache and context misconfiguration
The second trap is the one nobody configures on purpose. Every token of context the model attends to has a corresponding KV-cache entry in VRAM, which means your real memory footprint is weights plus KV cache, and the cache grows with the context window you request. Set a huge context and one of three things happens, often silently: the runtime shrinks something else to fit, it spills to system RAM and everything slows down, or it fails at an odd moment mid-conversation.
Speed isn’t the only cost. Long contexts also degrade quietly — attention spreads across stale, irrelevant material, and instruction-following gets worse the further your actual request sits from the context the runtime negotiated. The classic symptom is a model that “forgets” instructions halfway through a long session. That’s not the model getting dumber; that’s a context configuration you never consciously chose.
This is also where the corpus’s GGUF compatibility confusion lives: people don’t know what context length their model file actually supports or what their runtime actually loaded. Check the startup log for the negotiated context length — not the number you asked for, the number you got. Runtime defaults differ more than most people expect, which is one reason the same model file can behave differently in different front-ends; that’s a theme we dig into in Ollama vs raw llama.cpp in 2026.
Trap 3: The wrong runtime or backend for your silicon
The same model file, on the same machine, can run at meaningfully different speeds depending on which backend executes it — and which backend wins is a property of your silicon, not of the backends in general.
Two measurements from our lab make the point. On the Arc B60 Pro, we compared Vulkan against Intel’s OpenVINO runtime, and OpenVINO won — if you’d assumed Vulkan was always the answer on Intel Arc, you’d have left performance on the table (full results in OpenVINO beats Vulkan on Arc B60). Separately, on the R9700 we measured the gap between Ollama’s runner and raw llama.cpp on identical hardware — same model, same GPU, different front-end, different numbers (the same-hardware comparison).
The trap is concluding “local is slow” when what you’ve actually tested is one backend on one runtime with one set of defaults. Before writing off your hardware, test the same GGUF through a second execution path. For a map of which backend makes sense on which hardware family, see CUDA, ROCm, Vulkan, and OpenVINO compared.
Trap 4: No speculative decoding where the model supports it
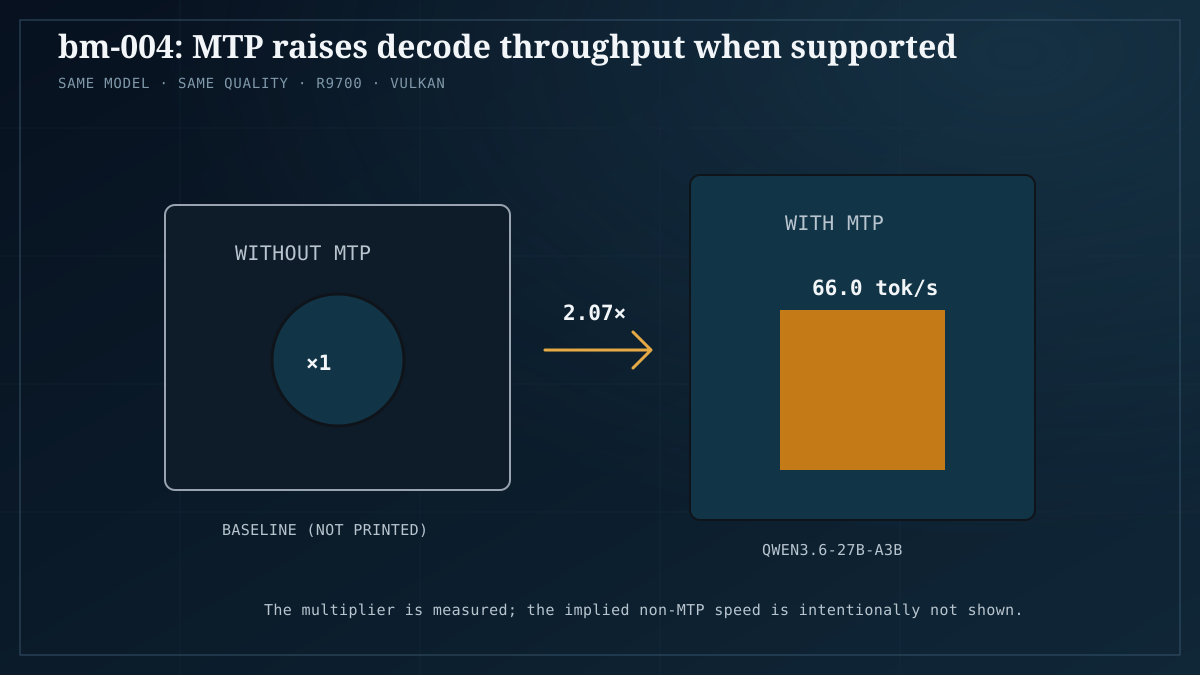
Speculative decoding — and multi-token prediction (MTP) specifically — is the rare optimization that costs nothing in quality, because the draft tokens are verified by the same model: the output distribution doesn’t change, only how fast you reach it. Yet most people never enable it, because it requires support on both sides: the model has to ship MTP heads, and the runtime has to implement the path.
When both sides line up, the gain is not subtle. In benchmark bm-004, we ran Qwen3.6-27B-A3B-Instruct (Q4_K_M-mtp) on the R9700 with llama.cpp’s Vulkan backend: 66.0 tok/s at 21.9 GB with MTP enabled, roughly 2.07× the without-MTP baseline on the same setup. Same model, same quality, more than double the decode speed.
If your model and runtime support MTP and you haven’t turned it on, you’re running at half speed for no reason. The support matrix and setup details are in Speculative decoding and MTP, measured.
Trap 5: Asking a small model to do an agentic task above its tier
Not every “dumb” answer is a configuration problem. The fifth trap is a mismatch between the model’s tier and the task class you’re asking of it — and it’s the trap most likely to be genuinely your fault rather than the stack’s.
A compact chat model can hold a conversation, summarize a document, draft an email. Ask the same model to drive a multi-step agent loop — plan, call tools, read results, recover from errors, keep state across turns — and it will fall apart, and the failure will look exactly like “this model is stupid.” It isn’t stupidity; it’s a task class above the model’s tier. Agentic reliability degrades faster with model size than chat quality does, which is why a model that feels fine in chat can feel broken in an agent harness.
The fix is matching tier to task class, not tuning. Our best local LLMs of 2026 roundup groups models by what they’re actually good at, which is the right place to start if your failing prompt is an agent loop.
Trap 6: A stale driver or toolchain
On newer hardware especially, the driver and compiler stack is part of the performance envelope, and it moves fast enough that a six-month-old install can be leaving large gains on the table.
The clearest recent example is third-party, so we cite it as exactly that: a report on the Arc B580 found that moving from Mesa 26.0.8 to 26.1.7 roughly doubled Q4_K_M decode speed — 30.25 to 66.99 tok/s. Different GPU than our B60 Pro results, different models, so treat it as directional rather than transferable. But the direction is the point: nothing about the model changed, nothing about the prompt changed — a driver update doubled throughput.
The trap is diagnosing your configuration for hours on a stack that’s two releases behind. Update the runtime, and on Linux with Intel graphics, update Mesa, before you conclude anything about the model. Backend rankings in particular can shift between driver releases, which is why we date-stamp everything in our backend comparison.
The 15-minute diagnostic checklist
Run these in order. Stop early if a step finds the problem.
| # | Check | Time | What to look for | Trap |
|---|---|---|---|---|
| 1 | Read your quant from the filename | 1 min | Anything below Q4 (IQ2, 1-bit, ternary)? Stop and re-download at Q4_K_M or better | 1 |
| 2 | Check the negotiated context length in the runtime log | 2 min | A number different from what you requested, or a default you never set | 2 |
| 3 | Check memory headroom: weights + KV cache vs VRAM | 2 min | Spill to system RAM, or a context setting that forced a smaller cache than you need | 2 |
| 4 | Run the same GGUF through a second backend or runtime | 3 min | A tok/s difference on an identical prompt — try raw llama.cpp if you’re on Ollama, or OpenVINO on Arc | 3 |
| 5 | Check MTP/speculative-decoding support for your model and runtime | 2 min | Supported but disabled — enable it and re-measure | 4 |
| 6 | Update the stack: runtime, and Mesa on Linux + Intel GPU | 3 min | A pending driver or runtime release | 6 |
| 7 | Re-run your original failing prompt | 1 min | Still failing with everything above fixed? It’s the model tier, not the config | 5 |
Two notes on using it. First, measure the same prompt before and after — tok/s on an identical input is the only comparison that means anything. Second, if step 7 is where you end up, that’s not a failure of the checklist; it’s the honest answer, and the next section is for you.
Honest caveats
Config fixes can’t rescue an overpromised model. Some models genuinely are weaker than their marketing, and no quant, runtime, or driver update changes that. If a model underperforms its own tier on tasks it should handle, believe the measurement, not the launch post.
Local still loses the capability ceiling to frontier cloud. Everything in this article narrows the gap that configuration creates. It does not close the gap that capability creates. For hard reasoning, very long context, or top-tier agentic work, frontier cloud models remain ahead, and that’s a hardware-and-scale reality rather than a settings problem — we keep the full picture in local vs cloud AI: the full comparison.
Our numbers are hardware-specific. bm-003 and bm-004 were run on an Arc B60 Pro and an R9700 respectively. Backend rankings, memory ceilings, and even quant trade-offs can look different on your silicon. Use our numbers as evidence that a trap exists and is measurable, then measure on your own machine.
The Mesa result is external and directional. It’s a third-party report on a different GPU (B580) with different models. We cite it because the effect size makes the point unmissable, not because it predicts your exact numbers.
HumanEval is a code benchmark. The five-point Q4_K_M penalty in bm-003 was measured on HumanEval pass@1 with a coder model. Chat quality may not move the same way — which is exactly why trap 1 is about matching quant to workload rather than avoiding Q4.
FAQ
Is Q4_K_M a bad quant? No — it’s a trade. On our bm-003 sweep it cost 5 HumanEval pass@1 points versus Q8_0 on a 30B coder model, while nearly doubling decode speed (38.6 vs 19.8 tok/s) and cutting memory from a saturated 24 GB to 18.1 GB. For chat and drafting that’s usually a good deal; for code quality it may not be. Match the quant to the workload.
Are 1-bit or 2-bit “brain damage quants” actually usable? The buzz is real in the corpus; the measurements aren’t, yet — our sweep starts at Q4. The reported symptom of extreme low-bit quants is precisely the “feels dumber” pattern this article is about. Until we publish numbers below Q4, treat quality claims at 1–2 bits as unproven and don’t judge local AI by them.
Why is Ollama slower than llama.cpp on my machine? Because Ollama runs its own runner with its own defaults on top of the same underlying engine, and those choices cost performance on some hardware. We measured the gap directly on the R9700 — same GPU, same model, different front-end — and the details are in the same-hardware comparison linked above.
Should I always enable speculative decoding or MTP? Whenever it’s supported, yes: in bm-004 it took Qwen3.6-27B-A3B from its baseline to 66.0 tok/s — roughly 2.07× — with no quality cost, because speculative tokens are verified by the same model. The catch is that it needs both model-level MTP support and runtime support, so it isn’t available for every setup.
Does a bigger context window make the model smarter? No. Larger contexts consume more VRAM through the KV cache, slow decoding, and can degrade instruction-following as attention spreads across stale material. Set the context you need, not the maximum your runtime offers, and verify what was actually negotiated in the log.
What if I fix all six traps and it still feels dumb? Then take the conclusion seriously: you may have a tier mismatch (trap 5) or a model that isn’t as good as its reputation. Pick a model matched to your task class from our best-local-LLMs roundup, and if your workload genuinely needs frontier-level capability, the local-vs-cloud comparison explains what you’d be giving up.
Every number in this article comes from LAF benchmark runs bm-003 and bm-004 or is explicitly attributed to a third-party report. Nothing is projected or estimated.